
What Is a Good RTO Rate? Sourced Benchmarks for India
No single RTO rate is good for every store. Here are the two published data sets I could trace, what they leave out, and how to set your own ceiling from your margin.
 By Nitish KumarOct 28, 2026 • 5 min read
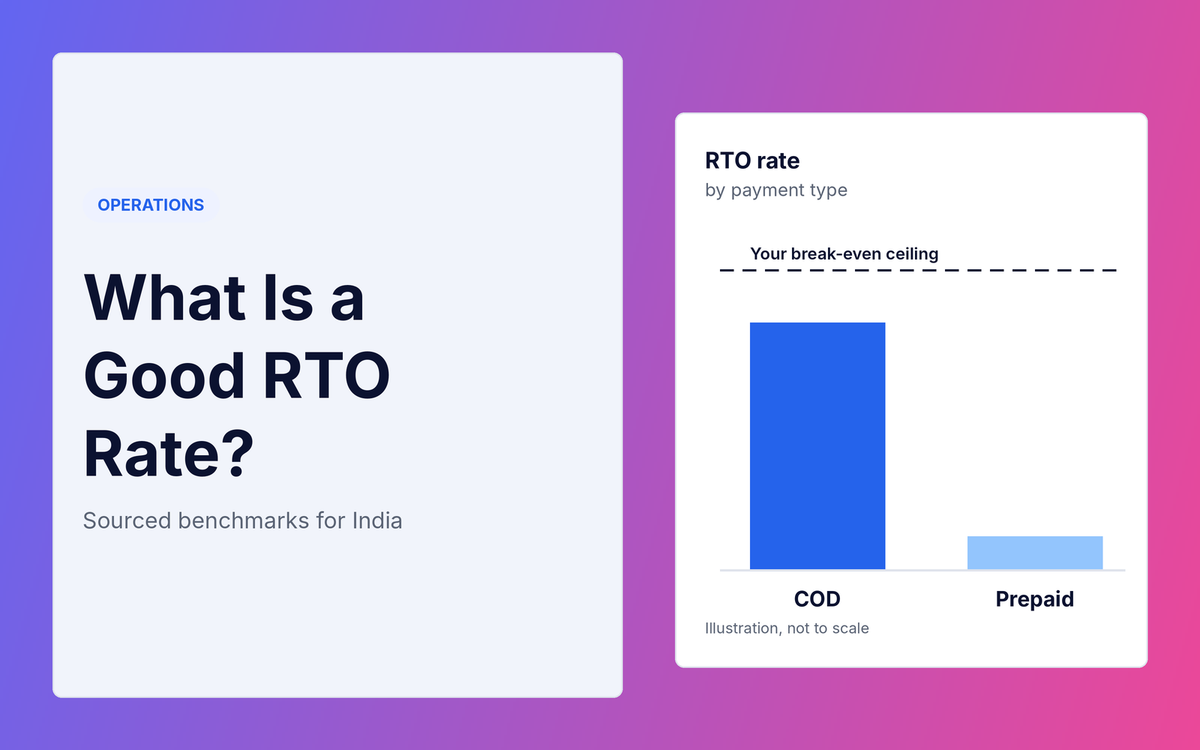
RTO stands for Return to Origin. In e-commerce, an RTO is an order that was shipped but not delivered, so it comes back to you. Everyone asks what rate is good, and most guides answer with a round number and no source. I looked for figures with a named report, a period and some detail on the data. I found two data sets, and both have limits. This post shows them, then shows you how to set a target from your own numbers.
What sourced RTO data exists for India?
Only two sources gave me a named report, a period and some detail on the data. Everything else I found was a rule of thumb with no method.
| Figure | What it measures | Source and period | Sample stated |
|---|---|---|---|
| About 26% | RTO on COD (non-prepaid) D2C orders | Shipway ShipNotes report, FY25 (2024-25), as reported by Media Infoline on 29 Jul 2025 | "Millions" of D2C shipments through Shipway. Number of brands not stated. |
| Under 2% | RTO on prepaid orders | Same report | Same |
| 18% to 35% | COD RTO by city: Vadodara was the lowest rate listed, Patna the highest | Same report | Cities with at least 5,000 non-prepaid orders |
| 58% vs under 15% | Festive-season "return rate", COD vs prepaid | Unicommerce India D2C Report, April 2026 | Whole report: 410M+ shipments, 6,000+ brands. Sample for these two figures not stated. |
| 39% down to 21% | RTO for some brands (the page also describes it as one brand's path), Nov 2025 to Feb or Mar 2026 | Unicommerce report page and MediaBrief coverage. The two give different end months. | Not stated |
How far can you trust these numbers?
Use them as reference points, not as a target. Here is why.
- They are not independent. Media Infoline describes Shipway as a Unicommerce subsidiary, and the Unicommerce report draws on Uniware and Shipway data. Treat them as one family of data, not two separate checks.
- They cover sellers on those platforms, not every Indian D2C brand.
- The metric is loose. Neither page gives a formula for RTO or says whether it counts orders or order value. The festive figure is called a return rate, which may not mean the same thing as RTO.
- The 39% to 21% change is described as "some brands" in one place and as one brand's path in another. Read it as one example of improvement, not a promise.
- I found no independent source, such as a government body or an industry association, with an RTO rate for D2C.
Several vendor guides also publish bands, for example a rate under 10% called strong, with no source, period or method. I do not use them here.
What the data does tell you
- COD and prepaid sit far apart. In the FY25 data the gap is about 26% against under 2%. A single blended rate hides it.
- Speed and place matter. In the same report, COD RTO was 22% when delivery was attempted within 1 to 2 days, 27% at 3 to 5 days and 35% after more than 5 days.
- Festive periods look worse. The festive figures in the Unicommerce report are well above the FY25 averages. The two sources define their numbers differently, so do not subtract one from the other.
How to set your own good RTO rate
1. Split COD and prepaid
Work out each rate separately and compare COD with COD. The formula and a worked example are in RTO in E-commerce: COD vs Prepaid.
2. Do not trust the blended rate
A store with less COD can show a lower blended rate even if its COD is worse. Example, not real data:
- Store A: 60 COD orders at 20% RTO and 40 prepaid at 2%. RTO orders: 12 + 0.8 = 12.8 out of 100, so 12.8%.
- Store B: 30 COD orders at 25% RTO and 70 prepaid at 2%. RTO orders: 7.5 + 1.4 = 8.9 out of 100, so 8.9%.
Store B looks better on the blended number, but its COD is worse (25% against 20%).
3. Find your break-even RTO rate
Your ceiling is the rate at which an order stops making money. Profit per order shipped is (1 − r) × M − r × C − A, where r is your RTO rate. Set it to zero and solve:
Break-even RTO rate = (M − A) ÷ (M + C)
- M: what you earn on a delivered order after product cost, forward shipping and fees, before ad spend.
- A: ad spend per order placed.
- C: the full cost of one RTO: forward shipping, return shipping, and packaging and handling.
Example, not real data: M = ₹400, A = ₹150, C = ₹130. (400 − 150) ÷ (400 + 130) = 250 ÷ 530 = 47%.
That is where you stop making money, not a target. It also ignores damaged returns and the days your cash is stuck. A good rate sits well below it and is not rising.
4. See what RTO costs you each month
Enter your orders and RTO rates in the free RTO Cost Calculator to get your monthly RTO cost and net loss.
5. Watch the trend
Check your rate each month, by payment type, PIN code and courier. A falling rate on the same mix tells you more than one headline number. To find what is driving yours, read 5 Common Reasons for RTO in E-commerce.
What is a good RTO rate: frequently asked questions
What is a good RTO rate in India?
There is no single sourced answer. The FY25 Shipway figures put COD RTO near 26% and prepaid under 2%, but they come from one platform's D2C shipments. Compare COD with COD and set a ceiling from your own break-even rate.
Is an RTO rate under 10% good?
It may be, but I found no source or method behind the usual claim. Whether it is realistic depends on your COD share. Check it against your own mix and break-even rate.
What is the average RTO rate for COD orders in India?
About 26% in the Shipway FY25 data for D2C shipments. It is one data set, with the limits above.
How often should I check my RTO rate?
Monthly, split by payment type. In a sale or festive period, check weekly, because the rate can move quickly.
Your action checklist
- Split last month's orders into COD and prepaid and work out each RTO rate.
- Work out your break-even RTO rate from your own M, A and C.
- Compare each rate with its own reference point, keeping the limits above in mind.
- Rank your PIN codes and couriers by RTO rate.
- Book a monthly review.
Your next step: Pull last month's orders, split them into COD and prepaid, and write down each RTO rate next to your break-even rate.
Sources: Shipway ShipNotes FY25, as reported by Media Infoline (29 Jul 2025); Unicommerce India D2C Report, April 2026; MediaBrief coverage of the same report.